2014 UK local government election
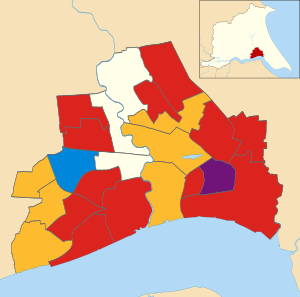
Map of the results of the 2014 Hull council election. Labour in red, Liberal Democrats in yellow, Conservatives in blue, UK Independence in purple, Uncontested in cream. The 2014 Hull City Council election took place on 22 May 2014 to elect members of Hull City Council in England.[1]
A total of 46,205 people voted from a registered electorate of 167,336. Turnout was therefore 27.6%.
After the election, the composition of the council was[1]
Labour 39 Liberal Democrat 15 Conservative 2 Independent 2 UK Independence 1 Ward results No elections were held in Beverley, Kings Park and Newland wards.
Avenue Avenue Party Candidate Votes % ±% Labour Majorie Ann Brabazon 1,303 Liberal Democrats Simone Butterworth 1,152 Green Martin John Deane 771 Conservative Alexander David Hayward 211 Majority 151 Rejected ballots 39 Turnout 3,476 35.4 Registered electors 9,818 Labour gain from Liberal Democrats Swing
Boothferry Boothferry Party Candidate Votes % ±% Liberal Democrats Ruth Deborah Payne 1,150 UKIP Paul Nigel Salvidge 809 Labour Philip David Pocknee 807 Conservative Daniel Mark Bond 154 Majority 341 Rejected ballots 14 Turnout 2,934 30.5 Registered electors 9,610 Liberal Democrats hold Swing
Bransholme East Bransholme East Party Candidate Votes % ±% Labour Anita Harrison 1,033 Liberal Democrats Eleanor Frances Wood 119 Conservative Colin Robert Baxter 111 Majority 914 Rejected ballots 30 Turnout 1,293 18.0 Registered electors 7,110 Labour hold Swing
Bransholme West Bransholme West Party Candidate Votes % ±% Labour Philip John Webster 596 UKIP Colin David Worrall 550 Liberal Democrats David Wood 57 Conservative Eden Barnes 48 Majority 46 Rejected ballots 6 Turnout 1,257 20.0 Registered electors 6,137 Labour hold Swing
Bricknell Bricknell Party Candidate Votes % ±% Conservative John Logan Fareham 1,161 Labour Karen Jane Rouse-Deane 669 UKIP Malcolm Peter Johnson 377 Green James Edward Russell 159 Liberal Democrats Sarita Roseanne Robinson 70 Majority 492 Rejected ballots 7 Turnout 2,443 37.4 Registered electors 6,525 Conservative hold Swing
Derringham Derringham Party Candidate Votes % ±% Liberal Democrats Cheryl Elizabeth Payne 967 UKIP Robert Brian Shepherd 731 Labour Gwendoline Lunn 696 Conservative Eleonor Ruth Whirehead 140 Majority 236 Rejected ballots 12 Turnout 2,546 28.2 Registered electors 9,004 Liberal Democrats hold Swing
Drypool Drypool Party Candidate Votes % ±% Liberal Democrats Linda Chambers 1,488 Labour Jannette Hornby 802 UKIP John Paterson 714 Conservative Salman Anwar 82 Majority 686 Rejected ballots 21 Turnout 3,107 32.0 Registered electors 9,702 Liberal Democrats hold Swing
Holderness Holderness Party Candidate Votes % ±% Liberal Democrats Jacqueline Dad 1,493 UKIP Surjit Singh 884 Labour Denise Thompson 846 Conservative John Mathew Crompton 113 TUSC Paul Spooner 67 Majority 609 Rejected ballots 7 Turnout 3,410 33.4 Registered electors 10,185 Liberal Democrats hold Swing
Ings Ings Party Candidate Votes % ±% Labour Michael Harold Thompson 1,267 UKIP Adam Phillips 940 Conservative Philip MacKay 236 Liberal Democrats John Graham Robinson 202 Majority 327 Rejected ballots 10 Turnout 2,655 28.0 Registered electors 9,448 Labour hold Swing
Longhill Longhill Party Candidate Votes % ±% Labour Carol Ann Clarkson 1,076 UKIP Sophie Fairburn 747 Conservative Leslie Harry Fisher 120 Liberal Democrats Elaine Lesley Keal 89 Majority 329 Rejected ballots 1 Turnout 2,033 23.0 Registered electors 8,741 Labour hold Swing
Marfleet Two vacancies to be filled, as a casual vacancy, created by the death of Councillor Sheila Waudby, was also to be filled.[2]
Marfleet Party Candidate Votes % ±% Labour Sean Chaytor 1,229 Labour Sharon Valerie Belcher 1,172 UKIP Julian Marcus Penna 640 Conservative Jake Michael Morrison 121 Conservative James Tristan Galer 108 Liberal Democrats Margaret Forrest Tompsett 105 Liberal Democrats Brian Charles Tompsett 94 Majority 57 Rejected ballots 7 Turnout 3,476 20.9 Registered electors 9,404 Labour hold Swing Labour hold Swing
Myton Myton Party Candidate Votes % ±% Labour Martin Mancey 1,020 UKIP Stanley Smith 740 Liberal Democrats Lee Gordon James Fallin 193 Green Michael John Lammiman 182 Conservative Joshua Myers 107 Majority 280 Rejected ballots 9 Turnout 2,251 21.7 Registered electors 10,270 Labour hold Swing
Newington Newington Party Candidate Votes % ±% Labour Alan Clark 839 UKIP Gillian Ann Coupland 450 Liberal Democrats Steven Vincent George Carter 224 Conservative Stephanie Anne Bond 90 Majority 389 Rejected ballots 15 Turnout 1,618 15.2 Registered electors 8,198 Labour hold Swing
Orchard Park & Greenwood Orchard Park & Greenwood Party Candidate Votes % ±% Labour Terence Geraghty 1,097 UKIP Karl William Hordon 833 Liberal Democrats Christine Elizabeth Randall 132 Green Carole Angela Needham 55 Conservative Dehenna Sheridan Davison 9 Majority 264 Rejected ballots 4 Turnout 2,130 22.7 Registered electors 9,400 Labour hold Swing
Pickering Pickering Party Candidate Votes % ±% Liberal Democrats Abigail Katherine Bell 1,321 Labour Malcolm Ernest Fields 766 UKIP Peter Mawer 631 Conservative Naomi Fuller 75 Majority 555 Rejected ballots 11 Turnout 2,804 30.9 Registered electors 9,101 Liberal Democrats hold Swing
Southcoates East Southcoates East Party Candidate Votes % ±% UKIP Richard Keith Barrett 638 Labour David William Gemmell 629 Conservative Samuel Gary Beckton 65 Liberal Democrats Allen Frederick Healand 53 Majority 9 Rejected ballots 4 Turnout 1,389 23.3 Registered electors 5,961 UKIP gain from Labour Swing
Southcoates West Southcoates West Party Candidate Votes % ±% Labour Stephen Brady 868 UKIP Mike Hookem 446 Conservative Oliver Harris 67 Liberal Democrats Michael Wilfred Chambers 54 TUSC Peter Rowland March 30 Majority 422 Rejected ballots 3 Turnout 1,468 24.8 Registered electors 5,929 Labour hold Swing
St Andrews St Andrews Party Candidate Votes % ±% Labour Nadine Fudge 608 UKIP Kenneth Andrew Fairburn 347 Independent Simon Peter Kelsey 150 Liberal Democrats Tracey Irene Henry 114 Conservative Robert Anthony Cook 40 Majority 261 Rejected ballots 3 Turnout 1,262 21.6 Registered electors 5,850 Labour hold Swing
Sutton Sutton Party Candidate Votes % ±% Liberal Democrats Terence Edward Keal 1,092 Labour Theresa Vaughan 924 UKIP John Anthony Morfitt 716 Conservative Christopher Oakley 134 Majority 168 Rejected ballots 13 Turnout 2,879 29.9 Registered electors 9,610 Liberal Democrats hold Swing
University University Party Candidate Votes % ±% Labour Steven Paul Wilson 702 UKIP Victoria Jayne Butler 611 Liberal Democrats Chris Randall 221 Green Richard John Howarth 120 Conservative Leon Sean French 117 Majority 91 Rejected ballots 3 Turnout 1,774 24.6 Registered electors 7,255 Labour gain from Liberal Democrats Swing
References ^ a b "Local election results 2014". Hull City Council. 23 May 2014. Archived from the original on 27 May 2014. Retrieved 6 June 2014 . ^ "Local elections". Hull City Council. Retrieved 24 June 2014 .
 Council elections in the East Riding of Yorkshire


