1998 UK local government election
The 1998 Basildon District Council election took place on 7 May 1998 to elect members of Basildon District Council in Essex, England. One third of the council was up for election and the Labour party stayed in overall control of the council.[3]
After the election, the composition of the council was
Labour 23 Liberal Democrats 13 Conservative 6[3] Election result 1998 Basildon Local Election Result[4] Party Seats Gains Losses Net gain/loss Seats % Votes % Votes +/− Labour 9 0 1 56.3 39.5 12,464 2.0 Conservative 5 4 0 31.3 35.0 11,046 6.8 Liberal Democrats 2 0 3 12.5 25.3 7,993 4.7 Socialist Alliance 0 0 0 0.0 0.2 59 New
All comparisons in vote share are to the corresponding 1994 election .
Ward results Billericay East Location of Billericay East ward Billericay East[5] Party Candidate Votes % Conservative Peter Patrick[6] 1,205 51.9% Liberal Democrats R. Dowden 815 35.1% Labour P. Reid 301 13.0% Turnout 26.2% Conservative gain from Liberal Democrats
Billericay West Location of Billericay West ward Billericay West[5] Party Candidate Votes % Liberal Democrats Michael Barr[7] 1,231 46.0% Conservative S. Horgan 1,196 44.7% Labour R. Austin 248 9.3% Turnout 25.7% Liberal Democrats hold
Burstead Location of Burstead ward Burstead[5] Party Candidate Votes % Conservative Geoffrey Buckenham[8] 1,061 45.8% Liberal Democrats G. Taylor 908 39.2% Labour M. Viney 348 15.0% Turnout 26.4% Conservative gain from Liberal Democrats
Fryerns Central Location of Fryerns Central ward Fryerns Central[5] Party Candidate Votes % Labour Paul Kirkman[9] 1,424 72.1% Conservative A. Hedley 324 16.4% Liberal Democrats M. Dickinson 226 11.4% Turnout 24.7% Labour hold
Fryerns East Location of Fryerns East ward Fryerns East[5] Party Candidate Votes % Labour John Potter[10] 1,261 73.1% Conservative D. Morris 321 18.6% Liberal Democrats J. Lutton 144 8.3% Turnout 22.4% Labour hold
Laindon Location of Laindon ward Laindon[5] Party Candidate Votes % Labour Colin Payn[11] 1,158 51.6% Conservative D. Walsh 812 36.2% Liberal Democrats V. Howard 275 12.2% Turnout 23.2% Labour hold
Langdon Hills Location of Langdon Hills ward Langdon Hills[5] Party Candidate Votes % Conservative S. Hillier 1,191 45.3% Labour M. Larkin 1,176 44.7% Liberal Democrats L. Williams 261 9.9% Turnout 27.4% Conservative gain from Labour
Lee Chapel Location of Lee Chapel North ward Lee Chapel[5] Party Candidate Votes % Labour Nigel Smith[12] 1,309 63.6% Conservative M. Levey 474 23.0% Liberal Democrats M. Dale 274 13.3% Turnout 27.3% Labour hold
Nethermayne Location of Nethermayne ward Nethermayne[5] Party Candidate Votes % Liberal Democrats Geoff Williams[13] 1,431 54.2% Labour T. Lomas 747 28.3% Conservative S. Allen 460 17.4% Turnout 38.7% Liberal Democrats hold
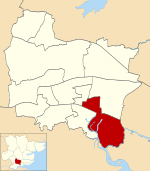
Pitsea East Location of Pitsea East ward Pitsea East[5] Party Candidate Votes % Labour Dave Marks[14] 1,187 Labour R. Rackham 1,040 Conservative K. Blake 860 Conservative P. Turner 796 Liberal Democrats D. Birch 209 Liberal Democrats A. Ferriss 171 Socialist Alliance D. Murray 59 Turnout 21.6% Labour hold
Pitsea West Location of Pitsea West ward Pitsea West[5] Party Candidate Votes % Labour P. Ballard 1,140 66.4% Conservative C. Coombes 395 23.0% Liberal Democrats J. Barr 183 10.7% Turnout 20.4% Labour hold
Vange Location of Vange ward Vange[5] Party Candidate Votes % Labour F. Kirkman 909 Labour L. Rossati 873 Conservative R. Cornish 349 Conservative S. Hillier 319 Liberal Democrats P. Jenkins 137 Liberal Democrats T. Marsh 124 Turnout 18.1% Labour hold
Wickford North Location of Wickford North ward Wickford North[5] Party Candidate Votes % Conservative Tony Ball[15] 1,052 38.8% Liberal Democrats M. Birch 1,042 38.5% Labour C. Wilson 614 22.7% Turnout 29.2% Conservative gain from Liberal Democrats
Wickford South Location of Wickford South ward Wickford South[5] Party Candidate Votes % Conservative Sylvia Buckley[16] 1,346 47.3% Liberal Democrats J. Pattison 857 30.1% Labour A. Ede 642 22.6% Turnout 25.1% Conservative gain from Liberal Democrats
References ^ "Council compositions by year". The Elections Centre. ^ "Local Election Summaries 1998". The Elections Centre. ^ a b "Policy and politics: Local Elections: Analysis: Council poll results". The Guardian ^ "Local Elections results". The Times ^ a b c d e f g h i j k l m n "Basildon District Council Election Results 1973–2012" (PDF) . Elections Centre. Retrieved 3 August 2019 . ^ "Billericay East". Basildon District Council . Archived from the original on 25 May 2001. Retrieved 12 October 2019 . ^ "Billericay West". Basildon District Council . Archived from the original on 18 November 2001. Retrieved 12 October 2019 . ^ "Burstead". Basildon District Council . Archived from the original on 7 July 2001. Retrieved 12 October 2019 . ^ "Fryerns Central". Basildon District Council . Archived from the original on 24 February 2002. Retrieved 12 October 2019 . ^ "Fryerns East". Basildon District Council . Archived from the original on 25 May 2001. Retrieved 12 October 2019 . ^ "Laindon". Basildon District Council . Archived from the original on 25 May 2001. Retrieved 12 October 2019 . ^ "Billericay West". Basildon District Council . Archived from the original on 25 May 2001. Retrieved 12 October 2019 . ^ "Nethermayne". Basildon District Council . Archived from the original on 25 May 2001. Retrieved 12 October 2019 . ^ "Pitsea East". Basildon District Council . Archived from the original on 25 May 2001. Retrieved 12 October 2019 . ^ "Wickford North". Basildon District Council . Archived from the original on 18 November 2001. Retrieved 12 October 2019 . ^ "Wickford South". Basildon District Council . Archived from the original on 6 October 2001. Retrieved 12 October 2019 .


 1
1  5
5 


 Council elections in Essex


